
CRUCIAL Covid figures used by Boris Johnson to trigger a second lockdown have sparked confusion after they were “downgraded” retrospectively.
Fresh data released by the Office of National Statistics suggests the number of new infections at the end of October was just half the grim forecast of more than 50,000 that was used by scientists to justify the lockdown.

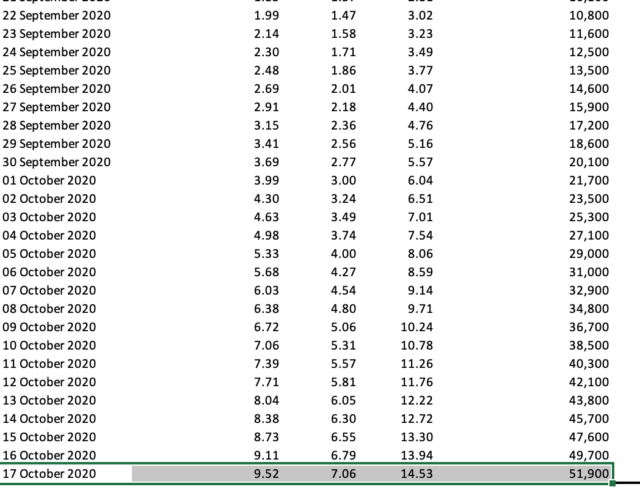
Figures published by ONS on October 30 – the day before Mr Johnson called for a national lockdown – said the rate of incidence of Covid-19 on October 17 had been 9.52 per 10,000 – or 51,900 new daily cases, according to modelled estimates.
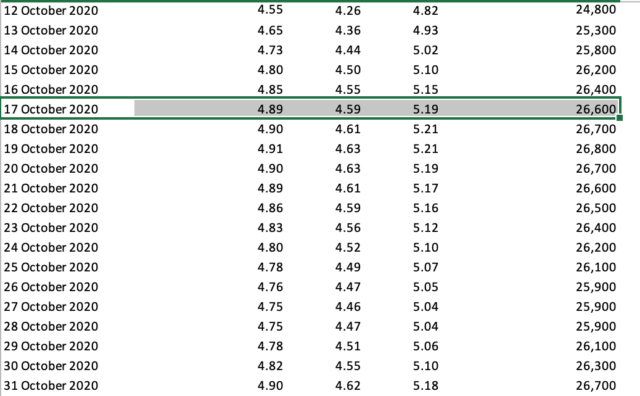
But in a revised drop of ONS stats on December 4, the incidence rate was downgraded to only 4.89 per 10,000 – or 26,600 cases – for October 17.
Despite this drop of almost half in the daily modelling data, statisticians said the “official estimates” have remained the same for the week from October 17 to October 23, at 9.52 per 10,000.
Asked to explain the discrepancy, the ONS said the daily modelled estimates are always “subject to change” – but insisted the much higher weekly estimates still remain the same.
Miring the figures in further confusion, this means the weekly figure is now more than double the revised data for any day that week.
When asked to explain why the weekly figure was not downgraded in line with the modelled daily numbers, statisticians did not provide an explanation, simply saying the modelling can be “smoothed” to show “trends” rather than daily figures.
The Department of Health officials stressed no single model is used to make decisions on coronavirus restrictions and said other data such as test positivity and daily deaths also informed decisions over restrictions.
The latest revisions to the ONS’ modelled estimates come after a string of dodgy data used to roll out tough new restrictions.
Official slides used by scientists to justify a second lockdown suggested 1,500 people a day could die by early December.
The Government’s top scientists Professor Chris Whitty, the chief medical officer, and Sir Patrick Vallance, the chief scientific adviser, came under fire last month for delivering a dire warning there could be 4,000 deaths a day by December.
OUT OF DATE
Another set of data shown in a Downing Street press conference was also found to be significantly out of date and could have been up to four times too high.
The forecasts, based on research done by Cambridge University three weeks before the Halloween press conference, suggested that England could see up to 4,000 deaths by the end of December.
The maximum estimated daily hospital admissions has also been revised down from 9,000 to 6,000 in recent weeks.
The ONS’ data is different to the actual number of people testing postive every day, as it checks for asymptomatic cases by testing a number of Brits regularly.
ONS insists the original data was based on modelled predictions and stressed that official estimates have not changed.
Statisticians said: “Our official estimates have not changed and these are the ones we advise to be used.”
They added the daily incidence is generated “using a modelled approach which means they are subject to change”.
And the modelling informs the official estimates – which have not changed.
“We therefore recommend using these to understand the trend, not for individual point in time estimation,” they said.
The UK Statistics Authority, the country’s official statistics watchdog, warned ministers against using coronavirus data in ways which could “confuse” the public.
The body said there was a danger that confidence in official figures will be undermined if they are issued without “appropriate explanations of context and sources”.
“The use of data has not consistently been supported by transparent information being provided in a timely manner,” a statement said.
“Full transparency is vital to public understanding and public confidence in statistics and those who use them.”
A spokesperson from the ONS said: “Our official estimates of infections are the best estimates based on the data over the past eight weeks at date of publication.
“We publish the full back-series of modelled estimates for transparency and these should not be considered ‘revised official estimates’.
“We have always advised people to use our official estimates as originally published as these are unaffected by the effects of policy changes that took place after publication.”
A spokesperson for the Department of Health said: “We introduced national restrictions to save lives, protect the NHS and the vulnerable, and drive down transmission of the virus.
“It is categorically untrue to suggest the pandemic was shrinking prior to 31 October.
“The decision to introduce national measures was based on an expert assessment of a range of factors including positive cases, rates in over 60 year old’s, hospital admissions and deaths – and these indicators were all clearly on an upwards trajectory as of late October with R above 1.
“It is not accurate to suggest we based a national policy on one study.”


